East Cobb GA Market Update: November 2026
By Deborah Morton, Managing Partner, The Agency Atlanta. RealTrends Top 1.5%.
If you own a home in East Cobb or are thinking about buying here, it helps to start with what actually sold. Here's a short look at the latest public numbers. Serving ZIPs 30062, 30066, 30067 and 30068.
About the dates: Sales figures below are from October 2026 (Redfin), the latest published. The listing numbers are also from October 2026 (Realtor.com). The Cobb County snapshot is from October 2026 (Georgia MLS).
October 2026 | ZIP 30062 | ZIP 30066 | ZIP 30067 | ZIP 30068 |
|---|---|---|---|---|
Median sale price* | $564,211 | $450,769 | $412,788 | $729,626 |
Change in median price vs. a year earlier | −0.14% | +3.3% | +4.5% | +14.0% |
Homes sold in October | 183 | 170 | 96 | 98 |
Median days on market* | 40 | 50 | 87 | 33 |
Sale-to-list price ratio | 97.7% | 97.9% | 96.9% | 97.8% |
Months of supply | Not published | Not published | Not published | Not published |
*Median sale price and days on market cover the three months ending October 2026. Source: Redfin. East Cobb has no official boundary, so these are ZIP-code figures for four Marietta ZIPs that cover much of it. Each ZIP may include some homes outside East Cobb. We show each ZIP on its own and never combine them.
Price: The median sale price was $564,211 in ZIP 30062 (−0.14% vs. a year earlier); $450,769 in ZIP 30066 (+3.3% vs. a year earlier); $412,788 in ZIP 30067 (+4.5% vs. a year earlier); $729,626 in ZIP 30068 (+14.0% vs. a year earlier).
Pace: The median home spent 33 to 87 days on the market, about 4.5 to 12.5 weeks.
Volume: 183 homes sold in ZIP 30062; 170 homes sold in ZIP 30066; 96 homes sold in ZIP 30067; 98 homes sold in ZIP 30068 in October 2026.
Sale-to-list: Homes sold for 96.9% to 97.9% of their final list price on average, so typical homes sold a little under list.
ZIP | Median list price | Change vs. Oct 2025 | Active listings | Median days on market (listings) |
|---|---|---|---|---|
30062 | $600,000 | +4.4% | 194 | 49 |
30066 | $500,000 | +3.4% | 206 | 52 |
30067* | $350,000 | −17.6% | 164 | 59 |
30068 | $699,950 | +3.7% | 106 | 63 |
*Asking prices (listings) for October 2026, not sale prices. Source: Realtor.com Economic Research. ZIP figures include homes outside the area. Realtor.com flags ZIP 30067's figures for data quality, so read them with caution.
Countywide October sales give county context alongside the ZIP sales above:
Cobb County, October 2026 | Value | vs. October 2025 |
|---|---|---|
Homes sold | 554 | −12.8% |
Median sale price | $422,498 | +0.8% |
New listings | 1,042 | −11.8% |
Homes put under contract | 421 | −28.0% |
Active listings | 2,663 | +7.6% |
Months of supply (our calculation) | about 4.8 | – |
*Residential sales and listings in Georgia MLS only. FMLS-only listings aren't included, so these counts don't cover every sale in the county. Source: Georgia MLS Market Snapshot, Cobb County, October 2026.
Active listings divided by October homes sold, calculated by Clareo Group from the Georgia MLS figures (2,663 ÷ 554) and labeled about 4.8. This is a county figure, not one for East Cobb.
In plain English: In Cobb County, fewer homes went under contract in October than a year earlier, and more homes were for sale. Across the four East Cobb ZIPs, median sale prices moved differently than the county median, and days on market ranged from about 4.5 weeks to about 12.5 weeks depending on the ZIP.
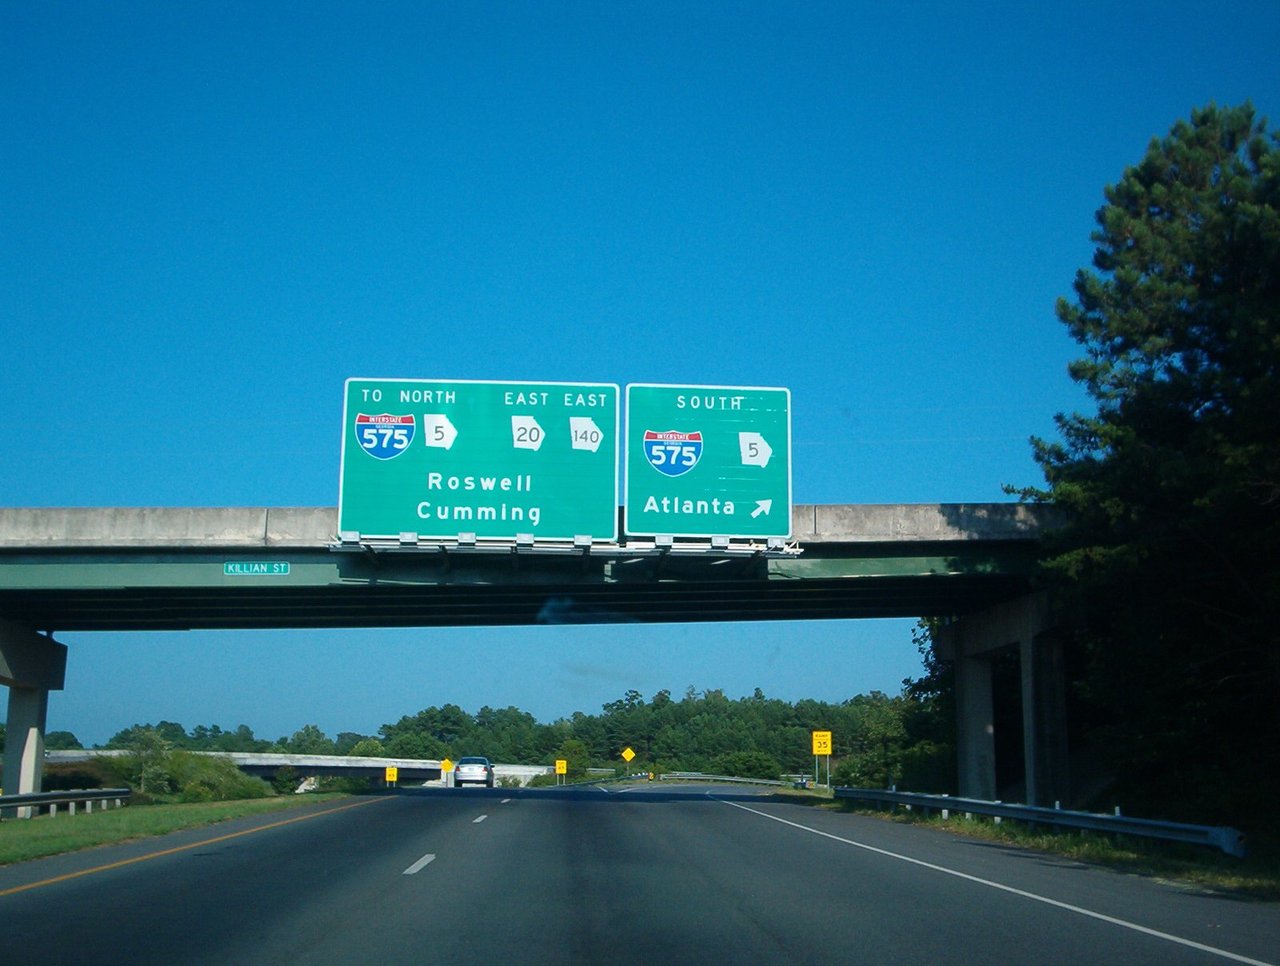
East Cobb is established and green. Mature trees, swim/tennis subdivisions built around a shared pool and courts, and wooded lots near the river are what set it apart. The Chattahoochee River National Recreation Area runs along its edge, with trails at Cochran Shoals and Sope Creek, where you can walk to the stone ruins of the Marietta Paper Mill. East Cobb Park, Mabry Park and Hyde Farm add more green space, and Johnson Ferry, Roswell and Powers Ferry Roads lead to I-75, I-285 and Sandy Springs. East Cobb is unincorporated, so most homes have a Marietta mailing address but sit outside city limits.
Want to know more about living here? Visit our East Cobb neighborhoods guide.
A median is the middle sale, so it moves with the mix of homes that sold, not just with values. Monthly sales counts here range from 96 to 183, so a few unusually large or small sales can move the median and the year-over-year change noticeably from one month to the next. Treat single-month swings with care. Sale and listing figures come from different sources and cover slightly different areas, so they won't line up exactly. Your own home's value depends on its condition, updates, lot and street, which an area-wide number can't show.
Curious how your home's condition stacks up? Try our free Home Report Card: Grade your home's condition (A–F), room by room. (It's a condition check, not a valuation.)
Sources: Redfin housing-market page, ZIP 30062; Redfin housing-market page, ZIP 30066; Redfin housing-market page, ZIP 30067; Redfin housing-market page, ZIP 30068, sales data for October 2026, retrieved November 18, 2026. Realtor.com Economic Research, Housing Inventory Core Metrics by ZIP, October 2026, retrieved November 18, 2026. Georgia MLS Market Snapshot, Cobb County, October 2026, retrieved November 18, 2026. Information deemed reliable but not guaranteed.
Clareo Group at The Agency Atlanta · (470) 990-4414 · Equal Housing Opportunity
Start Your New Home Search Now!
Stay up to date on the latest real estate trends.
You’ve got questions, and we can’t wait to answer them.