Sandy Springs Market Update: November 2026
Sandy Springs

Sandy Springs
By Deborah Morton, Managing Partner, The Agency Atlanta. RealTrends Top 1.5%.
If you own a home in Sandy Springs or are thinking about buying here, it helps to start with what actually sold. Here's a short look at the latest public numbers. Serving ZIPs 30328 and 30350, plus parts of 30327 and 30342.
About the dates: Sales figures below are from October 2026 (Redfin), the latest published. The listing numbers are also from October 2026 (Realtor.com). The Fulton County snapshot is from October 2026 (Georgia MLS).
October 2026 | City of Sandy Springs |
|---|---|
Median sale price* | $649,548 |
Change in median price vs. a year earlier | −5.8% |
Homes sold in October | 263 |
Median days on market* | 53 |
Sale-to-list price ratio | 96.4% |
Months of supply | Not published |
*Median sale price and days on market cover the three months ending October 2026. Source: Redfin. These are figures for homes inside City of Sandy Springs limits. ZIPs 30327 and 30342 are mostly in the City of Atlanta (Buckhead), which is why their listing figures differ from the city sales figures.
ZIP | Median list price | Change vs. Oct 2025 | Active listings | Median days on market (listings) |
|---|---|---|---|---|
30328 | $329,900 | −4.6% | 246 | 63 |
30350* | $290,000 | −49.8% | 102 | 52 |
30327 | $1,600,000 | +0.8% | 141 | 61 |
30342 | $745,000 | +0.1% | 136 | 58 |
*Asking prices (listings) for October 2026, not sale prices. Source: Realtor.com Economic Research. ZIP figures include homes outside the area. Realtor.com flags ZIP 30350's figures for data quality, so read them with caution.
Countywide October sales give county context alongside the city sales above:
Fulton County, October 2026 | Value | vs. October 2025 |
|---|---|---|
Homes sold | 800 | −17.1% |
Median sale price | $443,888 | +4.8% |
New listings | 1,795 | −5.9% |
Homes put under contract | 701 | −25.5% |
Active listings | 5,402 | −0.7% |
Months of supply (our calculation) | about 6.8 | – |
*Residential sales and listings in Georgia MLS only. FMLS-only listings aren't included, so these counts don't cover every sale in the county. Source: Georgia MLS Market Snapshot, Fulton County, October 2026.
Months of supply (our calculation): Active listings divided by October homes sold, calculated by Clareo Group from the Georgia MLS figures. This is a county figure, not one for Sandy Springs.
In plain English: In Fulton County, fewer homes sold and went under contract in October than a year earlier, while the number of homes for sale was about the same. In the City of Sandy Springs, the median sale price was about 6% below the year-earlier level, fewer homes sold than a year ago, and homes took about seven to eight weeks to sell.
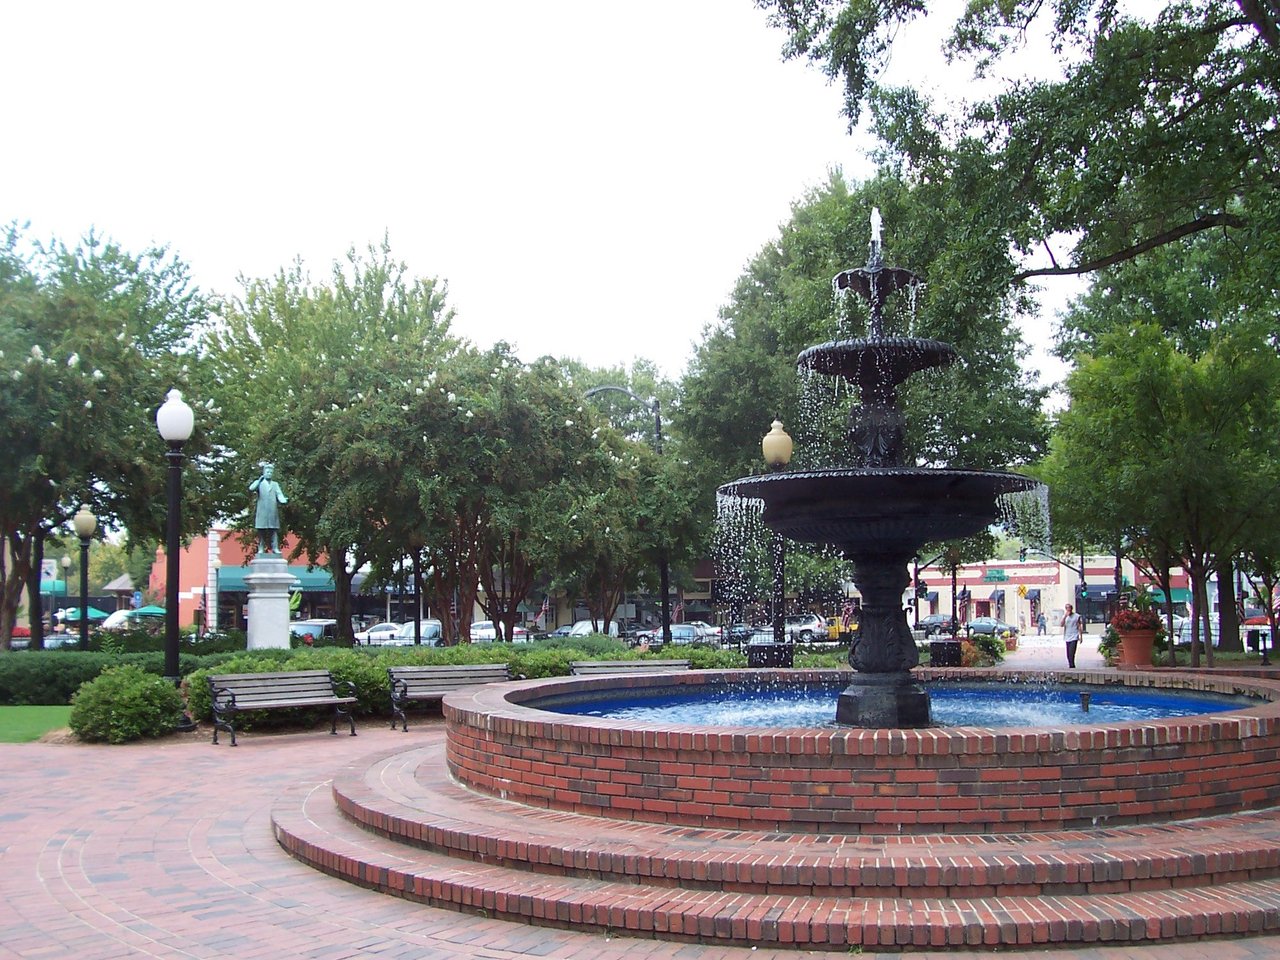
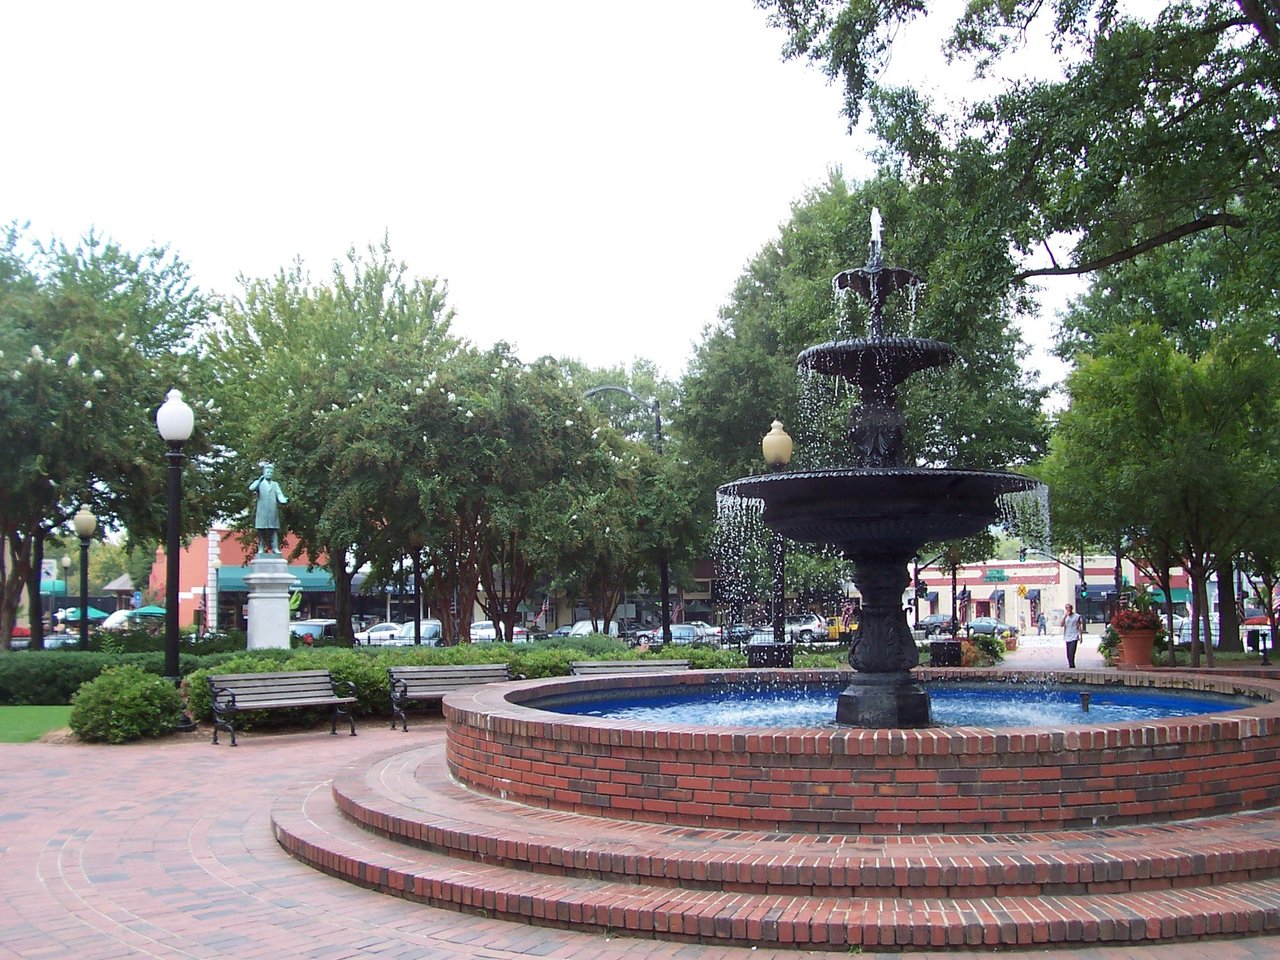
Sandy Springs centers on City Springs, the civic district with a performing arts center, a green and local restaurants. The Chattahoochee River runs along the city's western edge, with Morgan Falls Overlook Park and units of the Chattahoochee River National Recreation Area. GA-400 and I-285 meet here, and MARTA's Red Line has three stations in the city, including stops near the Perimeter Center business district. Homes range from high-rise and mid-rise condos to established neighborhoods of detached homes, including riverfront communities.
Want to know more about living here? Visit our Sandy Springs area page.
A median is the middle sale, so it moves with the mix of homes that sold, not just with values. The October count here is 263 sales, so a few unusually large or small sales can move the median and the year-over-year change noticeably from one month to the next. Treat single-month swings with care. Sale and listing figures come from different sources and cover slightly different areas, so they won't line up exactly. Your own home's value depends on its condition, updates, lot and street, which an area-wide number can't show.
What's my home worth?Request a free home valuation from our team.
Curious how your home's condition stacks up? Try our free Home Report Card: Grade your home's condition (A–F), room by room. (It's a condition check, not a valuation.)
Sources: Redfin housing-market page, City of Sandy Springs (redfin.com), sales data for October 2026, retrieved November 19, 2026. Realtor.com Economic Research, Housing Inventory Core Metrics by ZIP, October 2026. Georgia MLS Market Snapshot, Fulton County (gamls.com), October 2026, retrieved November 19, 2026. Information deemed reliable but not guaranteed.
Hero photo: "The King and Queen towers" by Maksim Sundukov, CC BY-SA 3.0, via Wikimedia Commons.
Clareo Group at The Agency Atlanta · (470) 990-4414 · Equal Housing Opportunity
Start Your New Home Search Now!
Stay up to date on the latest real estate trends.
You’ve got questions, and we can’t wait to answer them.